Credit: Matt Smith/Spotlight PA
Another election cycle is behind us, while an even more consequential one looms up ahead.
In what’s become a bit of a tradition, I’m here once again to take a look at the latest election results in Bucks County – both to get a sense of how the political winds are blowing and what they tell us about the future.
Advertisements
For this installment, I dusted off some 2017 maps that I made of the countywide contests (Controller, District Attorney, Prothonotary, Recorder of Deeds, and Sheriff) to compare to new maps I created of the 2021 races. So below you’ll see maps for each contest along with the vote totals for both 2017 and 2021. Afterwards, I’ll explain what I learned from compiling and examining these maps.
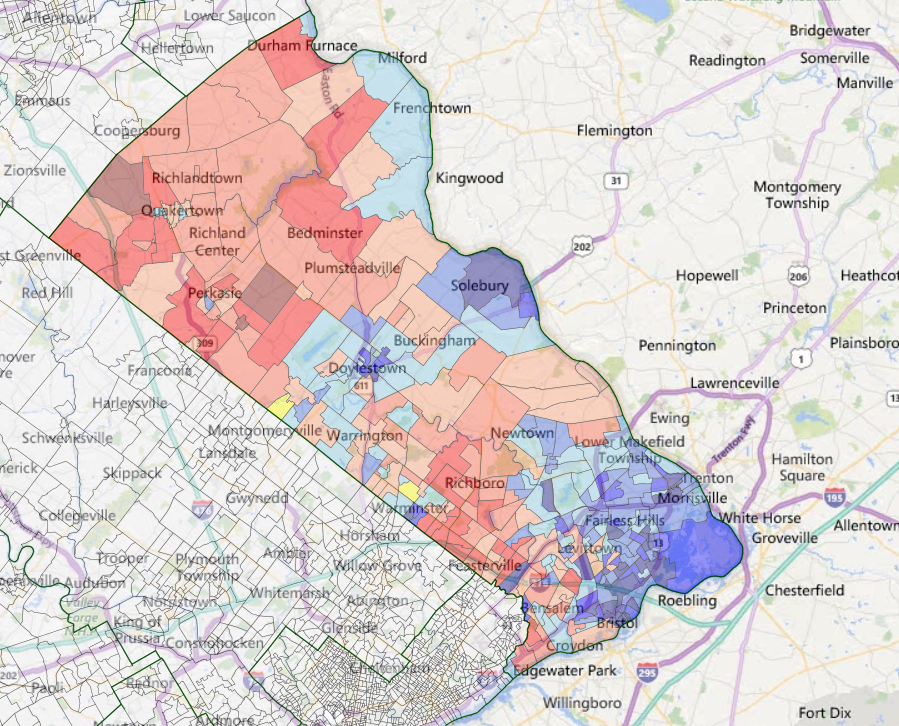
Controller
2017
Advertisements
Dem: Neale Dougherty – 63,966 (50.4%)
Rep: Michael Gallagher – 62,909 (49.6%)
Advertisements
Total: 126,875
2021

Dem: Neale Dougherty – 90,048 (47.8%)
Advertisements
Rep: Pamela Van Blunk – 98,143 (52.2%)
Total: 188,191
Advertisements
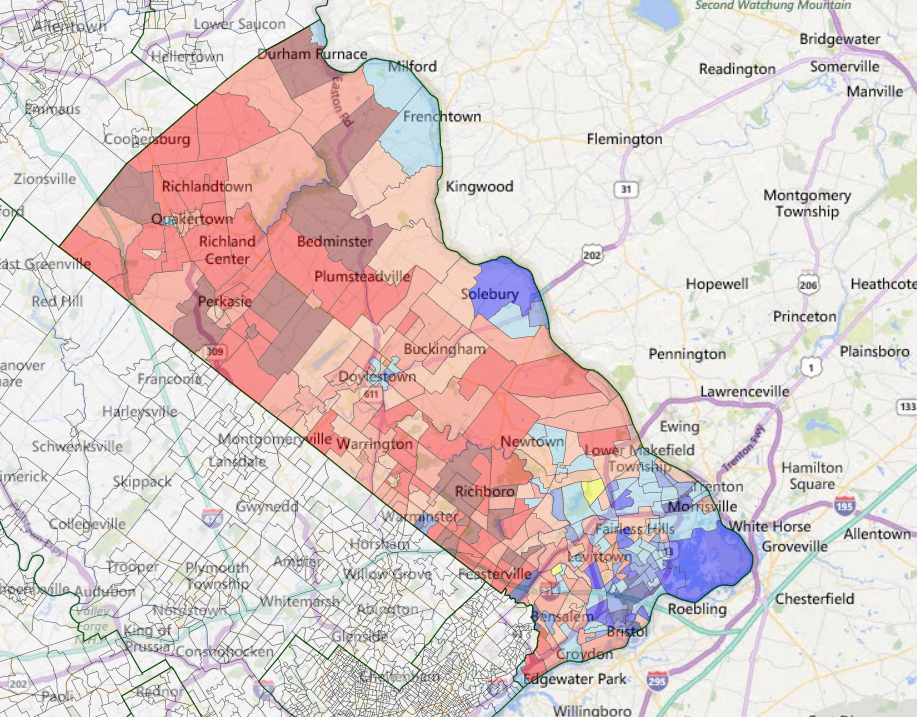
District Attorney
2017
Advertisements
Dem: Rich Scholer – 58,790 (45.6%)
Rep: Matt Weintraub – 70,190 (54.4%)
Advertisements
Total: 128,980
2021

Dem: Antonetta Stancu – 80,144 (41.6%)
Advertisements
Rep: Matt Weintraub – 110,878 (58.4%)
Total: 191,022
Advertisements
Prothonotary
2017
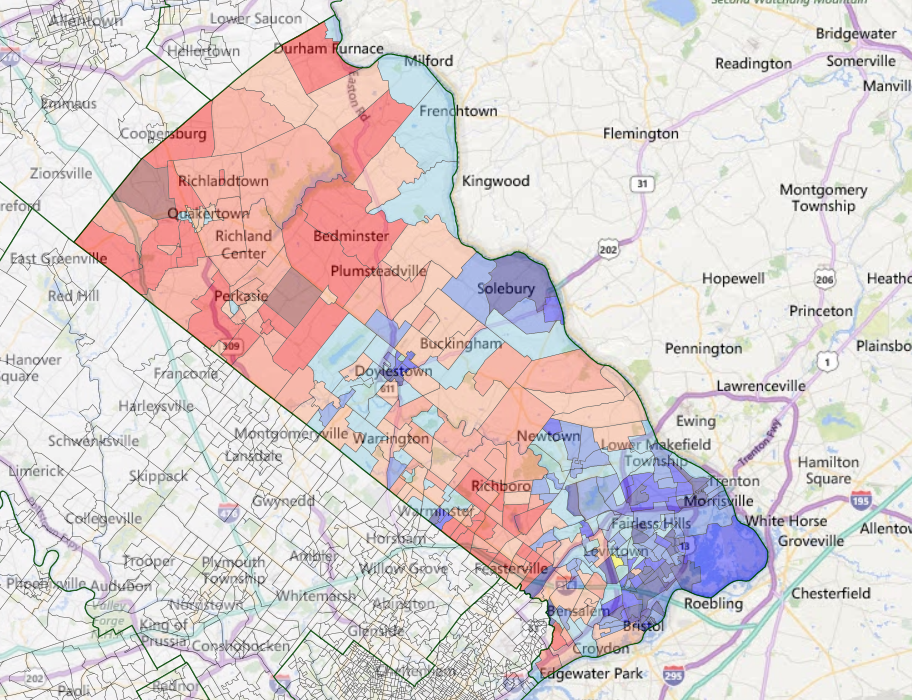
Dem: Judi Reiss – 64,667 (50.9%)
Advertisements
Rep: Colleen Strunk – 62,270 (49.1%)
Total: 126,937
2021

Advertisements
Dem: Judi Reiss – 90,789 (48.0%)
Rep: Coleen Christian – 98,358 (52.0%)
Total: 189,147
Recorder of Deeds
Advertisements
2017
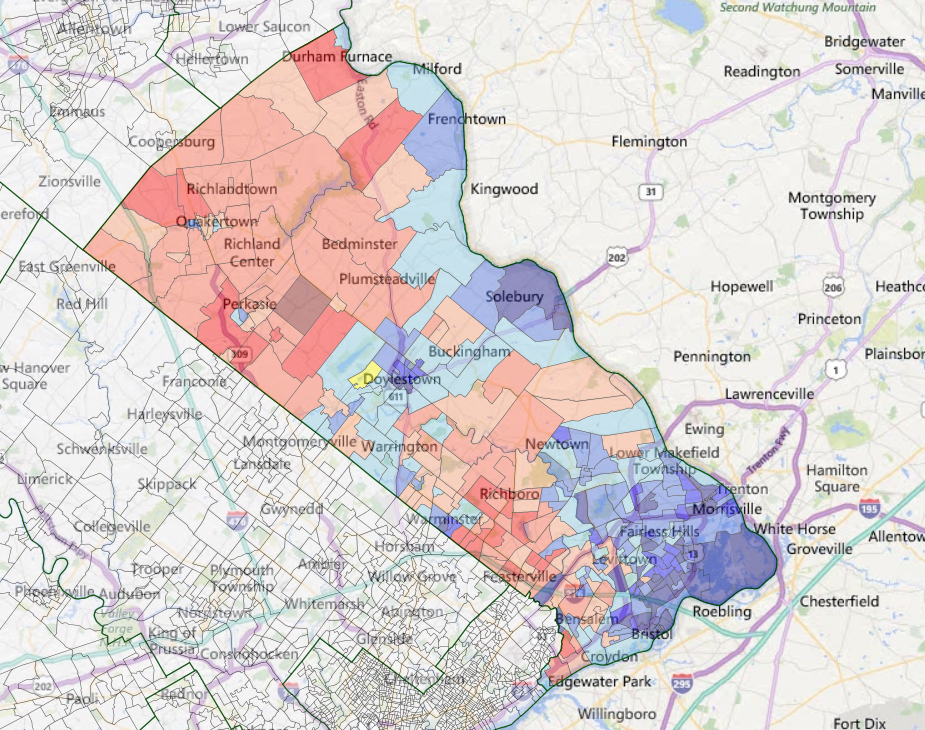
Dem: Robin Robinson – 65,546 (51.6%)
Rep: Joseph Szafran – 61,359 (48.4%)
Total: 126,905
2021

Dem: Robin Robinson – 92,925 (49.2%)
Rep: Dan McPhillips – 96,126 (50.8%)
Advertisements
Total: 189,051
Sheriff
2017
Dem: Milt Warrell – 64,805 (50.5%)
Rep: Edward Donnelly – 63,321 (49.5%)
Total: 128,126
2021
Dem: Mark Lomax – 90,347 (47.5%)
Rep: Fred Harran – 99,930 (52.5%)
Total: 190,277
Conclusions
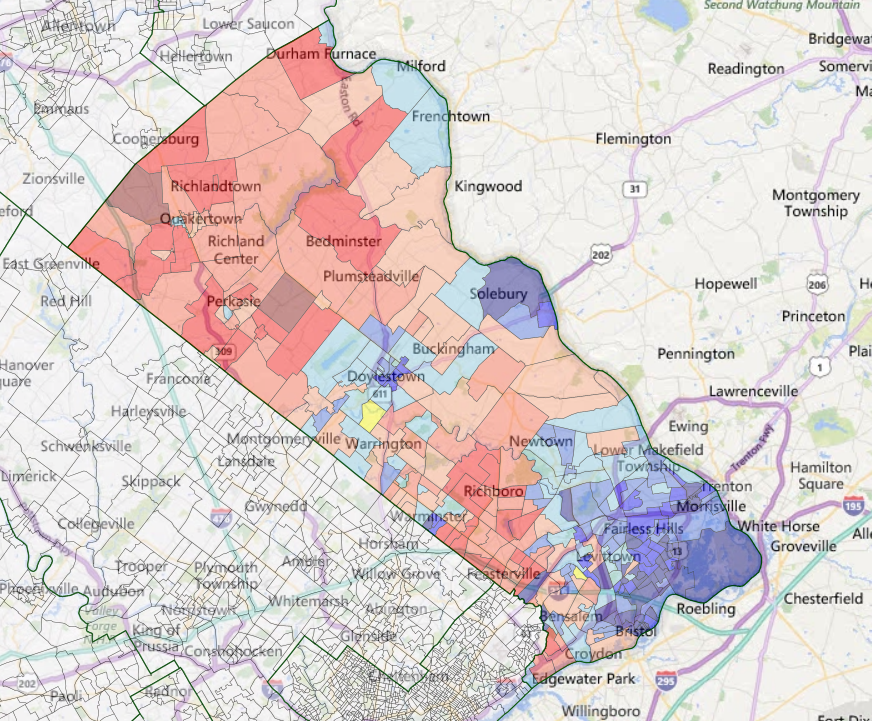
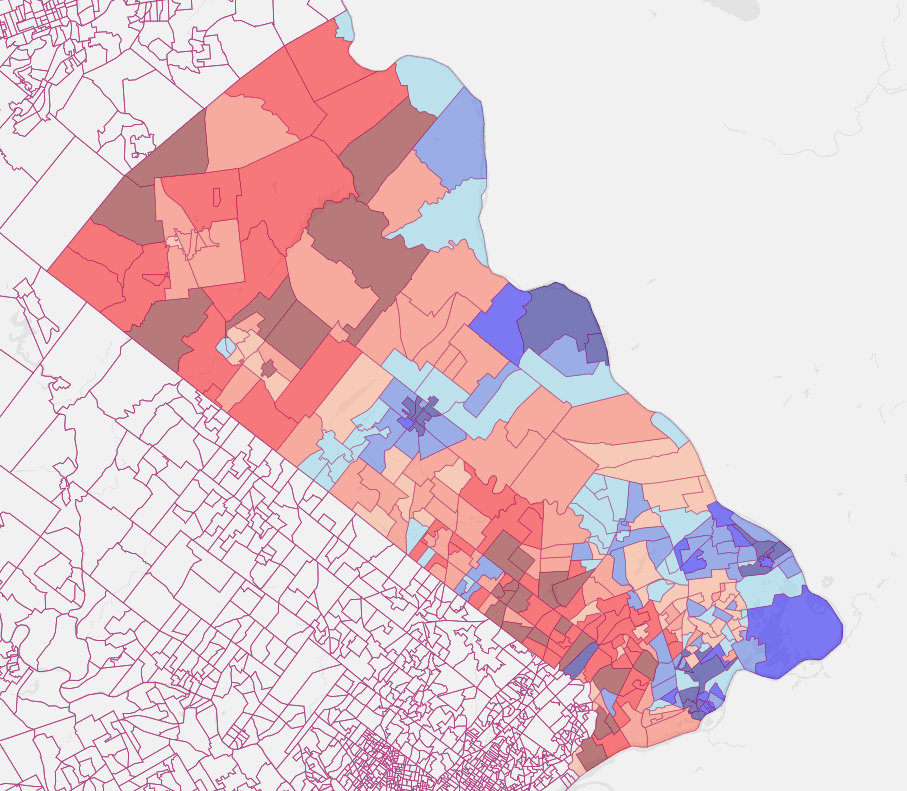
As I’ve observed before, Bucks County is a perfect microcosm of the political shifts taking place across the nation. Four years ago, Democrats won four out of the five countywide races. Last November, however, Republicans won a clean sweep. Unsurprisingly, those results closely mirror the national numbers. As traditionally happens, the party out of power prevails in the first year of a new President’s term, and that was the case for both Trump and Biden.
We can also see how the recent nationwide electoral trends are reflected at a county level. While Democrats continue to gain in the formerly Republican white-collar, college-educated areas of Bucks, the GOP is on the rise in the old reliably Democratic blue-collar, working-class sections.
In Lower Bucks County, for instance, we can see that the latter trend is not only persisting but actually accelerating. This red wave is most apparent in Falls and Middletown Townships, which of course make up Levittown. Republicans also built on recent successes in Bensalem as well, with DA Matt Weintraub even making gains in Bristol and Warminster.
Conversely, Democrats mostly held their own in places such as Lower Makefield and Newtown. Their candidates performed even stronger in communities like Solbury and Doylestown. In fact, the party improved in several Central Bucks County municipalities, including Buckingham, Chalfont and New Britain.
Heading north to Upper Bucks County, we find that one of the few bright spots of improvement for Democrats was in Sellersville and neighboring Perkasie. At the same time, Republicans gained ground in Quakertown across the board, while Weintraub was able to win riverside municipalities like Bridgeton and Riegelsville.
The most worrisome result for Bucks County Democrats, though, is undoubtedly the erosion in Lower Bucks County, particularly Levittown. The famous development is far and away the county’s most populous area, so sustained Republican growth there could allow the GOP to secure a strong foothold for the future.
Speaking of the future, for the moment it looks quite bright for Republicans in Bucks. Brian Fitzpatrick continues to keep a strong hold on his congressional seat, and should he decide to retire soon, the GOP has a strong successor now in Weintraub. Furthermore, the Democrats will have to defend five more row offices in 2023, which history again suggests will be an uphill fight.
One last point, these results also suggest that the GOP holds a huge turnout advantage. After all, over 60,000 more votes were cast in 2021 compared to 2017. So while the winds of change are always bound to shift, Bucks County Republicans nevertheless enter 2022 with all the momentum.
Report a correction via email | Editorial standards and policies